How it works
Consumption forecasts are produced and submitted every day without manual intervention
From data collection to the last intraday revision, the process runs every day on a fixed schedule, including weekends and public holidays. Trading rules in the intraday market (GİP) are set by the supplier; Wattica produces the forecasts and revisions.
A day in operation
From the morning before delivery to the next day's report
All times are Turkey time (UTC+3).
-
Day before delivery
MorningData is updated
OSOS, OSB, EPİAŞ and weather data is collected and checked. Gaps are filled.
-
Day before delivery
Before day-ahead gate closureDay-ahead forecast is sent
The next day's meter-level forecast is produced; Imbalance Optimisation is applied if it is in use. The forecast is sent to you, to your platform or to EPİAŞ.
-
Day before delivery
18:00Intraday market opens
The hourly revision cycle starts for each contract.
-
Delivery day
Until the contract closesRevisions continue
Each contract is revised until it closes. For example, the 15:00 contract closes at 14:00; by default the last revision is sent around 13:30. The timing can be adjusted.
-
Day after delivery
ReportResults are reported
Actual consumption, imbalance and cost are reported; dashboards are updated.
Technology
Meter-level models, retrained on every run
Meter-level modelling
Each meter is modelled separately, with its own consumption behaviour. The portfolio forecast is the sum of the meter forecasts.
Multiple models
Several machine learning approaches are evaluated for each meter, and the one with the best result is used.
Retrained on every run
Each time the forecasting engine runs, the models are retrained with the latest data. Their performance is monitored continuously.
Measurement and transparency
Results are reported against the supplier's own forecast
In the backtest: side by side with your forecast
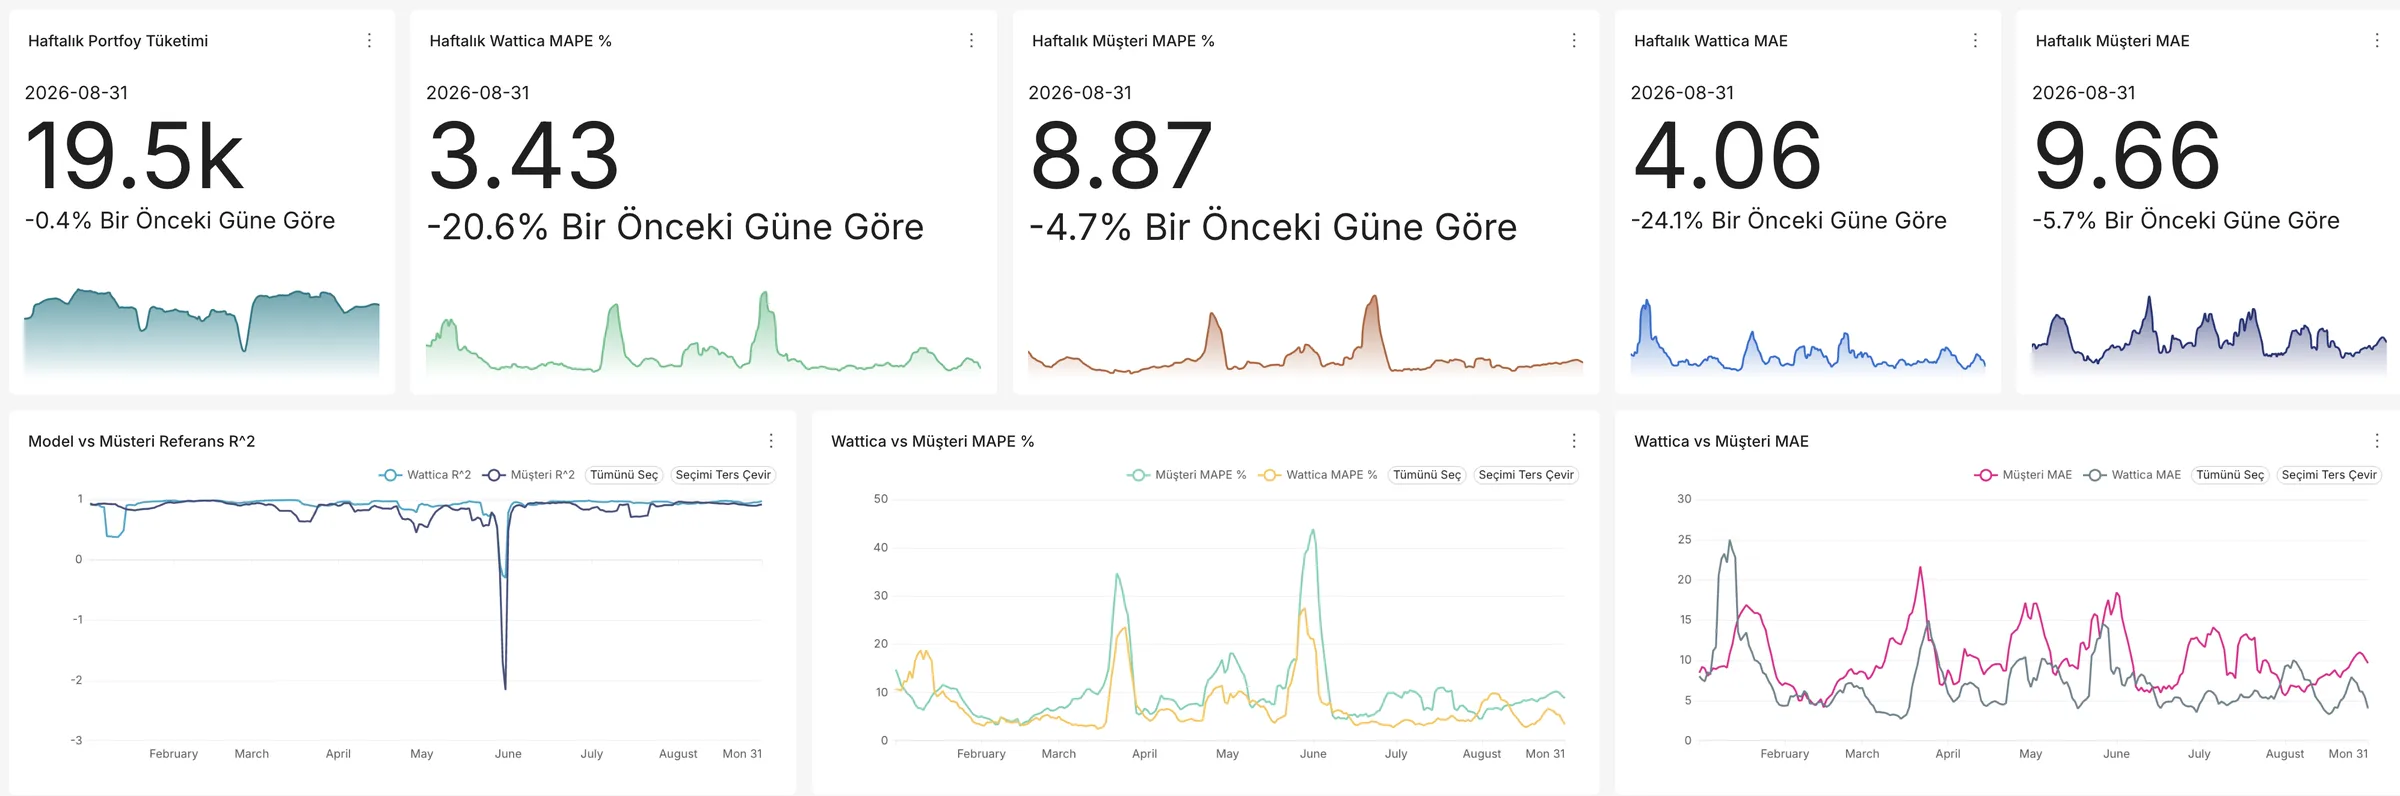
Wattica forecasts are compared with the forecasts you used for the same period. The difference is reported both in accuracy and in imbalance cost in TL.
In live operation: compared with a reference forecast
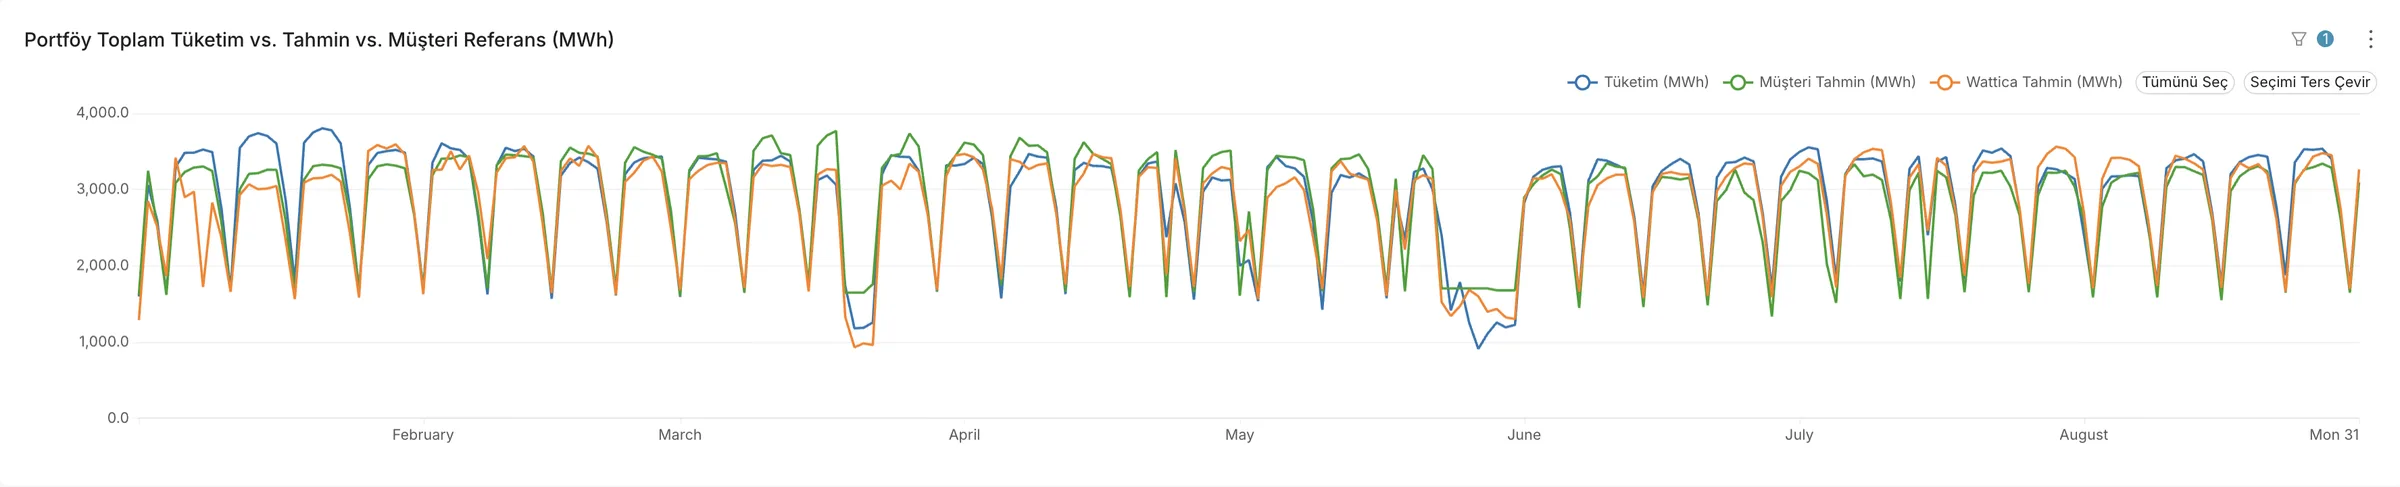
Dashboards show the Wattica forecast next to a reference forecast. If the supplier shares its own forecasting method (for example, a similar-day, similar-hour approach), the reference is calculated with that method; otherwise a default reference based on methods commonly used in the industry is applied.
Your actual imbalance before DSG netting
You also see your imbalance cost before netting within the balance responsible group (DSG). This shows today what the cost will be once the DSG effect is reduced.
Delivery and integration
Forecasts are delivered automatically
The delivery channel depends on the systems the supplier uses; more than one can be used at the same time.
EPİAŞ
The day-ahead forecast is submitted to EPİAŞ automatically, in line with the submission schedule.
Trading platforms
Turning intraday revisions into trades requires an algorithmic trading platform (such as SmartPulse, Senkron or VTC). Wattica sends forecasts to these platforms every hour; the platform service is provided separately.
Email reports
Daily forecast and OSOS consumption reports are sent as Excel or CSV files.
Dashboard
Forecast, actual consumption and imbalance are tracked on the web.
Dashboards
Forecast performance is updated every day
Forecast consumption, actual consumption, imbalance volume and cost are shown on the same screen. Performance is tracked monthly across the portfolio and daily for OSOS meters. The dashboards run on Apache Superset; users can build their own dashboards and upload their own imbalance calculations to analyse them alongside Wattica data. The screenshots below show the Turkish interface.

Getting started
A backtest on your own data before you buy
The first four steps are free and carry no purchase commitment.
- 1
Non-disclosure agreement
We sign a mutual non-disclosure agreement (NDA) before we see your data.
- 2
Data access
Through a read-only EPİAŞ user account that you set up for us, we access your meter list and consumption history. No installation is needed on your side.
- 3
Backtest
We simulate a past period day by day under real operating conditions. This takes about a week once access is in place.
- 4
Comparison
We go through a report with you that compares the results with your current forecast on accuracy and imbalance cost.
- 5
Agreement
If the results make sense for you, we prepare a proposal based on your portfolio size and the modules you choose.
- 6
Go-live
OSOS access is set up and the system is connected to your portfolio. The first month, during integration, is free.
What we need from you
- For the backtest
- A read-only user account set up for Wattica in EPİAŞ's EPYS system. The required permissions are sent separately.
- For go-live
- OSOS user credentials. For distribution companies with IP restrictions, the Wattica server IP needs to be allowlisted or a separate user account created.
- For OSB data
- Access to the relevant OSB portals.
Terms
Turkish market terms used on this site
- EPİAŞ
- Energy Exchange Istanbul (EXIST), the operator of Turkey's electricity markets and of imbalance settlement.
- EPYS
- EPİAŞ's market management system, where users and their permissions are defined.
- GÖP
- The day-ahead market.
- GİP
- The intraday market. Hourly contracts close one hour before delivery.
- DSG
- Balance responsible group. Members net part of their imbalances against each other before settlement.
- System direction
- Whether the system is in surplus (long) or in deficit (short) in a given hour. It determines how imbalances are priced.
- OSOS
- The automated meter reading system run by the distribution companies. It provides hourly consumption data.
- OSB
- Organised industrial zone. Some OSBs operate their own distribution network and meter data portal.
- KGÜP and EAK
- The finalised day-ahead generation schedule and the available capacity, submitted to EPİAŞ for generation facilities.
Frequently asked questions
Questions suppliers ask most often
We produce our forecasts in-house. How does the switch work?
Forecast production moves entirely to us; your team does not need to learn new software or build models. A read-only EPİAŞ user account is enough for the backtest, which takes about a week once access is in place. Go-live also requires OSOS access: OSOS credentials are shared or a separate user account is created for Wattica. Reports can be sent in the format you are used to.
Can we keep using our own forecast?
Yes. MetaCast Forecast Optimisation corrects the forecast you produce by learning from its past errors. You can also follow both forecasts side by side on the dashboards.
What about meters with no OSOS data, or with incomplete data?
The whole portfolio is forecast. Meters without OSOS data are forecast with statistical models.
What happens when our portfolio changes?
The current meter list is pulled from EPİAŞ automatically every month. Meters joining or leaving the portfolio are picked up by the system automatically.
Does Wattica trade in the intraday market?
No. Wattica produces the forecasts and revisions; intraday trades are executed through the algorithmic trading platform the supplier uses. If you do not have a platform, we can help with selection and setup.
How is pricing set?
We prepare a proposal based on your portfolio size and the modules you choose. The backtest and comparison are free, and there is no charge for the first month after go-live.
Request a backtest for your portfolio
In the first meeting we talk through your portfolio and the backtest process.
Request a meeting